
UNIT 2
BACK TO BASICS
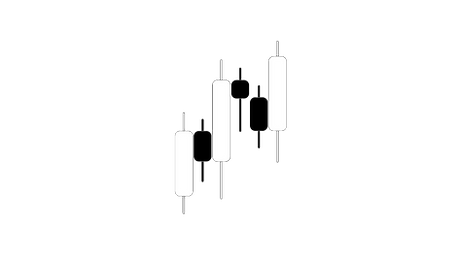
CANDLE REVIEW
CANDLE ANATOMY
CLOSING PRICE
Price point where the
candle closes

OPENING PRICE
Price point where the candle opens, also where the next candle will open
CANDLE WICK HIGH
Highest point price reached
CANDLE BODY
Reflects where price stayed for most of the candle
CANDLE WICK LOW
Lowest point price reached
CANDLE WICKS
For bullish candles
WICK RANGES
Wicks on candles are also ranges, however they are ranges on the smaller time frame - this is explained in further detail in Advanced Concepts
OPENING WICK
The opening of the next candle typically retraces a portion of the previous candle before continuing with its direction
Wicks will tell us if price is creating *structure as it is continuing in its direction.
In the case that its not, we can make more informed decisions on what price may want to do

The opposite applies for bearish candles
*Structure is the ability for price to create highs and lows so that price can 'drive' from a support
No Top/Bottom Wick
UNCERTAINTY
Candles that have no wicks give us less information on where it wants to go. As wicks are also ranges, a candle with a wick has left a range for the next candle to fill
Because of this, the candle has an uncertain chance of pushing up or retracing back down. We don't want to guess because it would be equivalent to gambling

SIGNS OF RETRACEMENT
Typically, we see price either reverse or retrace to grab more liquidity before continuing in its initial direction
However, it can also drive straight through like in the market example: price kept going

XAUUSD Market Example
'Le' Candle
Signs
The le candle is a name given to a candle which is showing signs of difficulty pushing in its current direction
More often than not these candles have a small body and leave a small wick or no wick for its next candle to fill
They also tend to have a long rejection wick which we can associate to signs of rejection and incoming change of structure


XAUUSD Market Example
Situation Based
With situations such as these, it really depends on what has happened leading up to the Le candle
Liquidity has a massive impact on how price action may play out
MARKET STRUCTURE
BULLISH TREND
BREAKOUTS & CONTINUATIONS
Ranges are still formed but price tends to break above and continue driving towards the next resistance
HIGHER HIGHS
In a bullish trend, price will continue to create higher highs and push price up, this will usually happen until price reaches a HTF resistance
minor resistance
LOWER LOWS
Alongside higher highs, price will create higher lows
Sometimes when price is grabbing Liquidity, it can break a previous low before rebreaking
its latest high

Liquidity Example
BEARISH TREND
LOWER HIGHS
As price continues to drive down, market structure will create lower highs

minor support
LOWER LOWS
In a bearish trend, price will continue to create lower lows and drive price down. This will usually happen until price reaches a HTF support
LIQUIDITY
When accounting for Liquidity, we may occasionally see a rebreak of a previous high before rebreaking its latest low

Liquidity Example
RANGES
SUPPORT & RESISTANCE
Whilst in a range, price respects support and resistance levels

ESTABLISHED RESISTANCE
Resistances at the top of a range is established with one bullish candle followed by one bearish candle

ESTABLISHED SUPPORT
Supports are formed with one bearish candle followed by a bullish candle

Occasionally you may get fakeouts, which are breakouts from the range, followed by closures back into the range.
This is also a form of liquidity

Fakeout Example
CHANGE OF STRUCTURE

LIQUIDITY & LOWER HIGH
BREAK OF PREVIOUS LOW
CONFIRMED LOWER LOWS
BEARISH STRUCTURE CONTINUATION
REACTION BASED TRADING
We don't need to predict or guess where structure is changing, just watch price and it will tell you
LIQUIDITY OR STRUCTURE CHANGE
When price is trending in a direction, a sudden change in market structure can be confusing
in Advanced Concepts we'll touch on how to differentiate between liquidity and actual market structure change
DVS SETUPS
BREAKOUTS

INTO THE NEXT RANGE
Breakouts refers to a candle closure above or below an established range, which usually is a good indication of volume
Breakouts can either be a sign of direction for price to continue with its previous trajectory, or it can also lead to liquidity or fakeouts
Use all time frames to determine which one is more likely to happen
FAKEOUTS

THE WRONG WAY
A fakeout is defined as a breakout in the opposite direction of the way price is currently pushing, followed by a closure back into the previous range and a continuation in the previous direction of price
When price is trending and pushing in a direction, it may require more liquidity to continue pushing. Usually this can be in the form of a fakeout
Make sure to remember the direction of travel for price so you do not get faked out and stuck in a losing position
ONIONS

TRADING THE RANGE
When trading in a range, we need the price to establish both a support and a resistance level (in any order). We refer to this as an 'onion'
Once these levels are set, we look for a simple range fill in the direction of momentum
Alternatively, you can view this as waiting for a higher low to form, then trading the confirmation of support into a higher high (in a bullish trend)
ADVANTAGE POINTS

HIGH PROBABILITY PRICE ACTION
Based off of previous price action, we have some indication of where price could tap into - following a breakout, price is likely to fill the next range
The overall range fill is usually our full TP as there is a high probability that price will tap that level
We can also use the break of the previous wick high as an intermediate advantage point, but to use this, we usually would like to see a bottom wick formed
This bottom wick is a stronger confirmation that price will not come back up as after the bottom wick (lower low) a rebreak of the highs (higher high) is usually followed by a push
previous
price action
OVERALL TP
ADVANTAGE POINT 1
ENTRY POINT
BREAKOUT
CONFIRMATION
UNIT 2
ADVANCED CONCEPTS
READING CANDLES BACKWARDS
WHY DO WE READ CANDLES BACKWARDS?
Reading candles backwards is a phrase we use to describe breaking down each individual HTF candle into its smaller components so that we can be more informed in our decision making and understanding of price action
At first, this is quite difficult to understand and use in your daily analysis, however, this is a key component of mastering technical analysis and price action. Candles tell you all the information about what price wants to do, and our job is to get a full picture using all the timeframes from HTF to LTF
1H
CANDLE STRUCTURE
30M
CANDLE STRUCTURE
15M
CANDLE STRUCTURE
{
{
4H RESISTANCE
4H SUPPORT

}
}
B
A
C
D
E
F
A Sometimes ranges can't be seen on the HTF, but is very clear on the LTFs
B Established range on the HTF will contain multiple ranges on the LTF
C Bottom wicks for previous candles. A standard 1H bullish candle can be broken down into four 15M candles where its story can be told in a very different way. Within this 1H candle, price grabbed liquidity and created a bottom wick for a no bottom wick previous 15 minute candle
D Breakout after liquidity. After grabbing liquidity, price once again breaks above recent highs. This time, we can be more confident that price will continue driving up, but we still need a breakout closure as confirmation
E 30M candle bottom wick for previous candle
F Fakeouts on HTF charts are just wicks, only on the LTFs can you see the full picture. Here you can clearly see a fakeout forming, which is enough liquidity for price to re-break the highs to continue its bullish structure
LIQUIDITY
NOTICING MARKET PATTERNS
Initially, we noticed that we were getting faked out relatively often. We adapted to the fakeouts and as we started watching fakeouts happen whilst we were patient on the charts, we asked ourselves: "Why does price create fakeouts?"
To answer this question, we paid more attention to what happens before and after fakeouts
BEFORE A FAKEOUT:
Price typically is ranging and has no direction. Often times, there is also less volume in the markets.
AFTER A FAKEOUT:
Price usually picks up more volume and is moving much quicker. It sometimes takes more time for price to choose its direction, but the fakeout usually turns into one of two scenarios:
1. Continuation and Rebreak of Highs/Lows
2. Market structure shift and a reversal after a top/bottom wick is created
LIQUIDITY
Our understanding of price action around the fakeout led us to understand that price sweeps highs/lows and creates steeper bottom wicks. This sweep usually breaks a previous structure point and mimics historic price action
RANGING
Price action before the fakeout and before liquidity tends to range. Typically price moves slower as there is less volume as well

BREAK OF STRUCTURE
For price to continue going up with the HTF, price will need to grab liquidity before continuing in its original direction
The liquidity typically exists as a steep wick, or on the LTF, a potential break of structure and fakeout
CONTINUATION
Price rebreaking highs/lows is a good indication of continuation. With liquidity, it typically increases the probability of this trade playing out in our favor
ENTRIES AND LIQUIDITY
PRICE ACTION WITHOUT LIQUIDITY
RISK OF STRUCTURE SHIFT
Without liquidity, there is a higher chance that price will reverse and break structure
Price never continues in the same direction infinitely and retracement is always a possibility
As such, Market structure is very important and will largely determine whether or not price has what it needs to continue

Minor Resistance
HTF VIEW 1H

Minor Resistance
LTF VIEW 30M
There is a very high chance that this market reversal is a HTF liquidity grab. On the LTF, it will look like a market reversal and structure shift
PRICE ACTION WITH LIQUIDITY
LOWER RISK
As price grabs liquidity, on the LTF it will look like a fakeout. On the HTF price will have created a steeper wick
Because price has already attempted to continue downwards, there is a much higher chance that price will have chosen its direction

Minor Resistance
HTF VIEW 1H
A Le Candle Forming

Minor Resistance
LTF VIEW 30M
This is where we can take our opportunity in the market. With further confirmations such as a breakout closure, the likelihood of price action continuing will be very high